Showing posts with label pnp4nagios. Show all posts

Sunday, October 14, 2012

Monitoring tool - pnp4nagios special template


When we use Icinga or Nagios with pnp4nagios for graphing the resources of hardwares or middle wares, we often want to look a resource graph from several services in one graph like load average of all of the servers or HTTP response time of web servers to compare them and examine each the difference.
We can make it by creating own templates called special template with pnp4nagios.

"special templates (starting with PNP 0.6.5) are used to combine data from arbitrary hosts and services and thus are not connected directly to a host or service.", says about pnp4nagios special template, here.

Then, what is it like the special template? This is an example which combines load average from all of the hosts in one graph.
sample_load.php
<?php
$this->MACRO['TITLE']   = "LOADAVERAGE";
$this->MACRO['COMMENT'] = "For All Servers";
$services = $this->tplGetServices("","LOADAVERAGE$");
# The Datasource Name for Graph 0
$ds_name[0] = "LOADAVERAGE";
$opt[0]     = "--title \"LOADAVERAGE\"";
$def[0]     = "";
# Iterate through the list of hosts
foreach($services as $key=>$val){
  $data = $this->tplGetData($val['host'],$val['service']);
  #throw new Kohana_exception(print_r($a,TRUE));
  $hostname   = rrd::cut($data['MACRO']['HOSTNAME']);
  $def[0]    .= rrd::def("var$key" , $data['DS'][0]['RRDFILE'], $data['DS'][0]['DS'] );
  $def[0]    .= rrd::line1("var$key", rrd::color($key), $hostname);
  $def[0]    .= rrd::gprint("var$key", array("MAX", "AVERAGE"));
}
?> 


The sample template is on my github. Please see the official reference for more detailed information about how to define the special template.

Next, I would like to demonstrate about how to create own template for the number of http accesses one by one, including setting up nagios plugin, pnp4nagios custom template and special template.
If you need to install Icinga or pnp4nagios, please see the past articles, here.

This is the graph which sample_apache_access.php generates.


  • setup nagios plugin (/usr/local/icinga/libexec)
# for modules in LWP::UserAgent Time::HiRes Digest::MD5 ; docpan -if $modules ; done
# wget  http://blog.spreendigital.de/wp-content/uploads/2009/07/check_apachestatus_auto.tgz -O- | tar zx
# ./check_apachestatus_auto.pl -H 127.0.0.1
APACHE OK - 0.050 sec. response time, Busy/Idle 1/9, open 246/256, ReqPerSec 0.4, BytesPerReq 17, BytesPerSec 5|Idle=9 Busy=1 OpenSlots=246 Slots=256 Starting=0 Reading=0 Sending=1 Keepalive=0 DNS=0 Closing=0 Logging=0 Finishing=0 ReqPerSec=0.350877 BytesPerReq=17 BytesPerSec=5.988304 Accesses=60

  • enable mod_status module if it's not enable(httpd.conf or including configuration)
ExtendedStatus On
<VirtualHost *:80>
  ServerName 127.0.0.1
  <Location /server-status>
    SetHandler server-status
    Order deny,allow
    Allow from 192.168.0.0/24
  </Location>
</VirtualHost>

  • define command and service configuration for Icinga/Nagios
define command{
        command_name    check_apache_performance
        command_line    $USER1$/check_apachestatus_auto.pl -H $HOSTADDREESS$ -t $ARG1$
}
define  service{
        use                    generic-service
        host_name               ha-mgr02, eco-web01, eco-web02
        service_description     Apache:Performance
        check_command           check_apache_performance!60
}
※Make sure that the hosts are defined on hosts.cfg.

  • setup custom template
    put check_apache_performance.php on /usr/local/pnp4nagios/share/template/
  • setup special template
    put sample_apache_access.php on /usr/local/pnp4nagios/share/templates.special/
  • Take a look at http://<your icinga server>/pnp4nagios/special?tpl=sample_apache_access

Lastly, I'm going to show you some examples.

Let's enjoy creating your own template and saving time to look around all of the graphs.

Monday, July 16, 2012

Monitoring tool - pnp4nagios custom template

I introduced about how to setup icinga an icinga-web, and setup icinga-web with pnp4nagios  to setup a monitoring server with icinga and pnp4nagios before. I'm going to show you pnp4nagios custom templates which influences the appearance of RRD graphs.

Why is it necessary to create custom templates?


I belive that the reason is that we are sometimes obliged to look into the graphs with specific hardware resource or performance data, when we analyze or investigate network devices, servers or middle ware performance, for example, how much cpu or memory resources are utilized, how much disk space is left, how much traffic is transferred, and so on.

If you need further information about custom templates for pnp4nagios, please see the official reference.

I'll give you an example of custom template based on default templates($pnp4nagios_prefix/share/templates.dist/interger.php) for traffic and graphs with nagios plugins, check_tcptraffic.

  • check_tcptraffic
# for module in \
Carp \
English \
Nagios::Plugin \
Readonly
do cpan -i install $module ; done
# wget https://trac.id.ethz.ch/projects/nagios_plugins/downloads/check_tcptraffic-2.2.4.tar.gz
# tar zxf check_tcptraffic-2.2.4.tar.gz
# cd check_tcptraffic-2.2.4
# check_tcptraffic -i eth0 -s 100 -w 10 -c 20
TCPTRAFFIC CRITICAL - eth0 182216 bytes/s | TOTAL=182216Byte;10;20 IN=180221Byte;; OUT=1995Byte;; TIME=204852Byte;; 
  • commands.cfg
define command{
        command_name    check_traffic
        command_line    $USER1$/check_tcptraffic -t $ARG1$ -s 1000 -w $ARG2$ -c $ARG3$ -i $ARG4$
        }
  • services.cfg 
define  service{
        use                     generic-service
        host_name               <hostname>
        service_description     TRAFFIC:eth0
        check_command           check_traffic!60!10000000!20000000!eth0
}
  • check_traffic.php (custom template for pnp4nagios)
    ※template_dirs=/usr/local/pnp4nagios/share/templates
<?php
$ds_name[1] = "$NAGIOS_AUTH_SERVICEDESC"; 
$opt[1] = "--vertical-label \"$UNIT[1]\" --title \"$hostname / $servicedesc\" ";
$def[1]  = rrd::def("var1", $RRDFILE[1], $DS[1], "AVERAGE");
$def[1] .= rrd::def("var2", $RRDFILE[2], $DS[2], "AVERAGE");
$def[1] .= rrd::def("var3", $RRDFILE[3], $DS[3], "AVERAGE");

if ($WARN[1] != "") {
    $def[1] .= "HRULE:$WARN[1]#FFFF00 ";
}
if ($CRIT[1] != "") {
    $def[1] .= "HRULE:$CRIT[1]#FF0000 ";       
}
$def[1] .= rrd::line1("var1", "#000000", "$NAME[1]") ;
$def[1] .= rrd::gprint("var1", array("LAST", "AVERAGE", "MAX"), "%6.2lf");
$def[1] .= rrd::area("var2", "#00ff00", "$NAME[2]") ;
$def[1] .= rrd::gprint("var2", array("LAST", "AVERAGE", "MAX"), "%6.2lf");
$def[1] .= rrd::line1("var3", "#0000ff", "$NAME[3]") ;
$def[1] .= rrd::gprint("var3", array("LAST", "AVERAGE", "MAX"), "%6.2lf");
?>

check_traffic.php generates the graphs below.


Other custom templates are open to the public at my github.
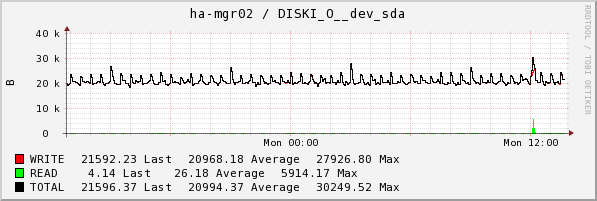
These are the list of custom templates and sample graphs.

  • check_apache_performance.php


  • check_connections.php


  • check_cpu.php
 
  • check_disk.php 
 
  • check_diskio.php
 
  • check_http.php

  • check_load.php
 
  • check_mem.php
 
  • check_mysql_health.php
 
  • check_nagios_latency_service.php
 
  • check_traffic.php

Friday, May 4, 2012

Monitoring tool - init script for icinga, ido2db(idoutils), and npcd(pnp4nagios)

As installing finishes icinga, icinga-web, and pnp4nagios, it's necessary to setup init scripts to run and stop daemon. Of course, each of the source files includes ones, but I prefer a typical format based on RPM package to the ones in the source file. So I modified the init scripts based on RPM packages.

I am going to introduce of  each of the init scripts and verification about how they work.
They are open to the public in my github.
  • daemon and init script
Icinga (based on Nagios RPM package) /etc/init.d/icinga
IDOUtils ( based on NDOUtils RPM package) /etc/init.d/ido2mod
PNP4nagios ( based on Nagios RPM Package a little) /etc/init.d/npcd

icinga

  • create init script based on nagios RPM package
    The patch file is stored here.
# yumdownloader --enablerepo=rpmforge icinga
# mkdir work
# cd work
# rpm2cpio ../ nagios-3.2.3-3.el5.rf.x86_64.rpm | cpid -id ./etc/rc.d/init.d/nagios
# cp etc/rc.d/init.d/nagios ./icinga
# cp icinga{,_diff}
...
# diff -c icinga icinga_diff > icinga.patch
# patch -p0 < icinga.patch
# cp icinga /etc/init.d/icinga
  • start daemon
# /etc/init.d/icinga start
Starting icinga:                                           [  OK  ]
  • stop daemon
# /etc/init.d/icinga stop
Stopping icinga:                                           [  OK  ]
  • restart daemon
# /etc/init.d/icinga restart
Stopping icinga:                                           [  OK  ]
Starting icinga:                                           [  OK  ]
  • condrestart daemon
# /etc/init.d/icinga condrestart
Stopping icinga:                                           [  OK  ]
Starting icinga:                                           [  OK  ]
  • reload daemon
# /etc/init.d/icinga reload
icinga (pid  17359) is running...
Reloading icinga:                                          [  OK  ]
  • check if daemon is running
# /etc/init.d/icinga status
icinga (pid  17359) is running...
  • difference between nagios(rpmpackage) and icinga
# diff -u nagios icinga_diff
--- nagios     2012-05-01 23:34:15.000000000 +0900
+++ icinga_diff        2012-05-03 20:52:17.000000000 +0900
@@ -1,36 +1,38 @@
 #!/bin/sh
 # $Id$
-# Nagios      Startup script for the Nagios monitoring daemon
+# Icinga      Startup script for the Nagios monitoring daemon
 #
 # chkconfig:  - 85 15
-# description:        Nagios is a service monitoring system
-# processname: nagios
-# config: /etc/nagios/nagios.cfg
-# pidfile: /var/nagios/nagios.pid
+# description:        Icinga is a service monitoring system
+# processname: icinga
+# config: /usr/local/icinga/etc/icinga.cfg
+# pidfile: /var/run/icinga.pid
 #
 ### BEGIN INIT INFO
-# Provides:           nagios
+# Provides:           icinga
 # Required-Start:     $local_fs $syslog $network
 # Required-Stop:      $local_fs $syslog $network
-# Short-Description:    start and stop Nagios monitoring server
-# Description:                Nagios is is a service monitoring system
+# Short-Description:    start and stop Icinga monitoring server
+# Description:                Icinga is is a service monitoring system
 ### END INIT INFO

 # Source function library.
 . /etc/rc.d/init.d/functions

-prefix="/usr"
-exec_prefix="/usr"
-exec="/usr/bin/nagios"
-prog="nagios"
-config="/etc/nagios/nagios.cfg"
-pidfile="/var/nagios/nagios.pid"
-user="nagios"
+user="icinga"
+prog="icinga"
+prefix="/usr/local/$prog"
+exec_prefix="${prefix}"
+exec="${prefix}/bin/$prog"
+config="${prefix}/etc/$prog.cfg"
+piddir="/var/run"
+lockdir="/var/lock/subsys"
+pidfile="$piddir/$prog.pid"
+lockfile="${lockdir}/$prog"

+[ -d "$piddir" ] || mkdir -p piddir && chown $prog:$prog $piddir
 [ -e /etc/sysconfig/$prog ] && . /etc/sysconfig/$prog

-lockfile=/var/lock/subsys/$prog
-
 start() {
     [ -x $exec ] || exit 5
     [ -f $config ] || exit 6
@@ -47,7 +49,7 @@
     killproc -d 10 $exec
     retval=$?
     echo
-    [ $retval -eq 0 ] && rm -f $lockfile
+    [ $retval -eq 0 ] && rm -f $lockfile $pidfile
     return $retval
 }

@@ -60,7 +62,7 @@
 reload() {
     echo -n $"Reloading $prog: "
     killproc $exec -HUP
-    RETVAL=$?
+    retval=$?
     echo
 }

@@ -70,8 +72,8 @@

 check_config() {
         $nice runuser -s /bin/bash - $user -c "$corelimit >/dev/null 2>&1 ; $exec -v $config > /dev/null 2>&1"
-        RETVAL=$?
-        if [ $RETVAL -ne 0 ] ; then
+        retval=$?
+        if [ $retval -ne 0 ] ; then
                 echo -n $"Configuration validation failed"
                 failure
                 echo
  • about the pidfile and the lockfile path
    Icinga.cfg(also nagios.cfg) defines lockfile as pidfile.
    I'm not sure why they're defined as so, but I think they should be separated.
    I defined he path of pidfile and lockfile in the init script and icinga.cfg
# grep '^lock_file'icinga.cfg
lock_file=/var/run/icinga.pid
# egrep '^(pid|lock)' /etc/init.d/icinga 
piddir="/var/run"
lockdir="/var/lock/subsys"
pidfile="$piddir/$prog.pid"
lockfile="${lockdir}/$prog"

ido2db

  • create init script for ndoutils based on ndo2utils RPM packageThe patch file is stored here.
# yumdownloader --enablerepo=rpmforge ndo2utils
# mkdir work
# cd work
# rpm2cpio ../ndoutils-1.4-0.beta7.3.el5.rf.x86_64.rpm | cpio -id ./etc/init.d/ndoutils
# cp etc/init.d/ndoutils ./ido2db
# cp ido2db{,_diff}
# vi ido2db_diff
...
# diff -c ido2db ido2db_diff > ido2db.patch
# patch -p0 < ido2db.patch
# cp ido2db /etc/init.d/ido2db
  • start daemon
# /etc/init.d/ido2db start
Starting ido2db:                                           [  OK  ]
  • stop daemon
# /etc/init.d/ido2db stop
Stopping ido2db:                                           [  OK  ]
  • restart daemon
# /etc/init.d/ido2db restart
Stopping ido2db:                                           [  OK  ]
Starting ido2db:                                           [  OK  ]
  • condrestart daemon
# /etc/init.d/ido2db condrestart
Stopping ido2db:                                           [  OK  ]
Starting ido2db:                                           [  OK  ]
  • difference between ndo2utils(rpmpackage) and ido2db
# diff ndoutils ndoutils_diff

@@ -1,37 +1,42 @@
 #!/bin/sh
-# Startup script for ndo-daemon
+# Startup script for ido2db-daemon
 #
 # chkconfig: 2345 95 05
-# description: Nagios Database Objects daemon
+# description: Icinga Database Objects daemon

 # Source function library.
 . /etc/rc.d/init.d/functions

-
-BINARY=ndo2db-3x
-DAEMON=/usr/sbin/$BINARY
-CONFIG=/etc/nagios/ndo2db.cfg
-
-[ -f $DAEMON ] || exit 0
-
-prog="ndo2db"
+prog=ido2db
+user=icinga
+prefix=/usr/local/icinga
+exec=$prefix/bin/$prog
+config=$prefix/etc/ido2db.cfg
+piddir="/var/run"
+lockdir="/var/lock/subsys"
+pidfile="$piddir/$prog.pid"
+lockfile="${lockdir}/$prog"

 start() {
+    [ -x $exec ] || exit 5
+    [ -f $config ] || exit 6
     echo -n $"Starting $prog: "
-    daemon --user nagios $DAEMON -c $CONFIG
-    RETVAL=$?
+    daemon --user $user $exec -c $config
+    retval=$?
+    [ $retval -eq 0 ] && touch $lockfile
     echo
-    return $RETVAL
+    return $retval
 }

 stop() {
-    if test "x`pidof $BINARY`" != x; then
+    if test "x`pidof $prog`" != x; then
         echo -n $"Stopping $prog: "
-        killproc ndo2db-3x
+        killproc $prog
         echo
     fi
-    RETVAL=$?
-    return $RETVAL
+    retval=$?
+    [ $retval -eq 0 ] && rm -f $lockfile $pidfile
+    return $retval
 }

 case "$1" in
@@ -44,14 +49,14 @@
             ;;

         status)
-            status $BINARY
+            status $prog
             ;;
         restart)
             stop
             start
             ;;
         condrestart)
-            if test "x`pidof $BINARY`" != x; then
+            if test "x`pidof $prog`" != x; then
                 stop
                 start
             fi
@@ -63,5 +68,5 @@

 esac

-exit $RETVAL
+exit $retval
  • about the pidfile and the lockfile path
    Icinga.cfg(also nagios.cfg) defines lockfile as pidfile.
    I'm not sure why they're defined as so, but I think they should be separated.
    I defined he path of pidfile and lockfile in the init script and icinga.cfg
# grep '^lock_file'ido2db.cfg
lock_file=/var/run/ido2db.pid
# egrep '^(pid|lock)' /etc/init.d/icinga 
piddir="/var/run"
lockdir="/var/lock/subsys"
pidfile="$piddir/$prog.pid"
lockfile="${lockdir}/$prog"


npcd

  • create init script for npcd based on nagios RPM packageThe patch file is stored here.
# yumdownloader --enablerepo=rpmforge icinga
# mkdir work
# cd work
# rpm2cpio ../ nagios-3.2.3-3.el5.rf.x86_64.rpm | cpid -id ./etc/rc.d/init.d/nagios
# cp etc/rc.d/init.d/nagios ./npcd
# cp npcd{,_diff}
...
# diff -c npcd npcd_diff > npcd.patch
# patch -p0 < npcd.patch
# cp npcd /etc/init.d/npcd
  • start daemon
# /etc/init.d/npcd start
npcd is stopped
Starting npcd:                                             [  OK  ]
  • stop daemon
# /etc/init.d/npcd stop
npcd (pid  14128) is running...
Stopping npcd:                                             [  OK  ]
  • restart daemon
# /etc/init.d/npcd restart
Starting npcd:                                             [  OK  ]
  • condrestart daemon
# /etc/init.d/npcd condrestart
npcd (pid  14216) is running...
Stopping npcd:                                             [  OK  ]
Starting npcd:                                             [  OK  ]
  • reload daemon
# /etc/init.d/npcd reload
npcd (pid  14233) is running...
Reloading npcd:                                            [  OK  ]
  • check if daemon is running
# /etc/init.d/npcd status
 npcd (pid 14233) is running...
  • difference between nagios(rpmpackage) and npcd
# diff -u npcd npcd_diff
--- npcd       2012-05-04 10:47:11.000000000 +0900
+++ npcd_diff  2012-05-03 22:45:28.000000000 +0900
@@ -1,41 +1,40 @@
 #!/bin/sh
-# $Id$
-# Nagios      Startup script for the Nagios monitoring daemon
-#
-# chkconfig:  - 85 15
-# description:        Nagios is a service monitoring system
-# processname: nagios
-# config: /etc/nagios/nagios.cfg
-# pidfile: /var/nagios/nagios.pid
 #
 ### BEGIN INIT INFO
-# Provides:           nagios
-# Required-Start:     $local_fs $syslog $network
-# Required-Stop:      $local_fs $syslog $network
-# Short-Description:    start and stop Nagios monitoring server
-# Description:                Nagios is is a service monitoring system
+# Short-Description: pnp4nagios NPCD Daemon Version 0.6.16
+# Description: Nagios Performance Data C Daemon
+# chkconfig: 345 99 01
+# processname: npcd
+# config: /usr/local/pnp4nagios/etc/npcd.cfg
+# pidfile: /var/run/npcd.pid
+# Provides:          npcd
+# Required-Start:
+# Required-Stop:
+# Default-Start:     2 3 4 5
+# Default-Stop:      0 1 6
 ### END INIT INFO

 # Source function library.
 . /etc/rc.d/init.d/functions

-prefix="/usr"
-exec_prefix="/usr"
-exec="/usr/bin/nagios"
-prog="nagios"
-config="/etc/nagios/nagios.cfg"
-pidfile="/var/nagios/nagios.pid"
-user="nagios"
+user="icinga"
+prog="npcd"
+prefix="/usr/local/pnp4nagios"
+exec_prefix="${prefix}"
+exec="${prefix}/bin/$prog"
+config="${prefix}/etc/$prog.cfg"
+piddir="/var/run"
+lockdir="/var/lock/subsys"
+pidfile="/var/run/$prog.pid"
+lockfile="${lockdir}/$prog"

 [ -e /etc/sysconfig/$prog ] && . /etc/sysconfig/$prog

-lockfile=/var/lock/subsys/$prog
-
 start() {
     [ -x $exec ] || exit 5
     [ -f $config ] || exit 6
     echo -n $"Starting $prog: "
-    daemon --user=$user $exec -d $config
+    daemon --user=$user $exec -d -f $config
     retval=$?
     echo
     [ $retval -eq 0 ] && touch $lockfile
@@ -47,7 +46,7 @@
     killproc -d 10 $exec
     retval=$?
     echo
-    [ $retval -eq 0 ] && rm -f $lockfile
+    [ $retval -eq 0 ] && rm -f $lockfile $pidfile
     return $retval
 }

@@ -60,31 +59,14 @@
 reload() {
     echo -n $"Reloading $prog: "
     killproc $exec -HUP
-    RETVAL=$?
+    retval=$?
     echo
 }

-force_reload() {
-    restart
-}
-
-check_config() {
-        $nice runuser -s /bin/bash - $user -c "$corelimit >/dev/null 2>&1 ; $exec -v $config > /dev/null 2>&1"
-        RETVAL=$?
-        if [ $RETVAL -ne 0 ] ; then
-                echo -n $"Configuration validation failed"
-                failure
-                echo
-                exit 1
-
-        fi
-}
-

 case "$1" in
     start)
         status $prog && exit 0
-      check_config
         $1
         ;;
     stop)
@@ -92,33 +74,21 @@
         $1
         ;;
     restart)
-      check_config
         $1
         ;;
     reload)
         status $prog || exit 7
-      check_config
         $1
         ;;
-    force-reload)
-      check_config
-        force_reload
-        ;;
     status)
         status $prog
         ;;
-    condrestart|try-restart)
+    condrestart)
         status $prog|| exit 0
-      check_config
         restart
         ;;
-    configtest)
-        echo -n  $"Checking config for $prog: "
-        check_config && success
-        echo
-      ;;
     *)
-        echo $"Usage: $0 {start|stop|status|restart|condrestart|try-restart|reload|force-reload|configtest}"
+        echo $"Usage: $0 {start|stop|status|restart|condrestart|reload}"
         exit 2
 esac
 exit $?


I will list the other configurations for icinga, idoutils, and pnp4nagios next time.

Monitoring tool - setup icinga-web with pnp4nagios

As introducing how to install Icinga and Icinga-web before, I am trying to install pnp4nagios and setup icinga-web with pnp4nagios. As Nagios and Icinga themselves have no graphing function, some may use Cacti or Munin for graphing performance data.  There's an addon called PNP4nagios released in Nagios Addon Project, which analyzes performance data provided by nagios-plugins and stores them automatically into RRD-databases.


Then, let's see how to install pnp4nagios and integrate it into Icinga-web. 

install pnp4nagios

  • install rrdtool, perl-rrdtool
# rpm --import http://apt.sw.be/RPM-GPG-KEY.dag.txt
# rpm -ivh http://pkgs.repoforge.org/rpmforge-release/rpmforge-release-0.5.2-2.el5.rf.x86_64.rpm
# sed -i 's|enabled\s\?=\s\?1|enabled = 0|' /etc/yum.repos.d/rpmforge.repo
# yum -y install pango.x86_64 pango-devel.x86_64 glib2.x86_64 glib2-devel.x86_64
# yum -y --enablerepo=rpmforge install rrdtool perl-rrdtool  
  • install pnp4nagios
$ curl http://downloads.sourceforge.net/project/pnp4nagios/PNP-0.6/pnp4nagios-0.6.16.tar.gz | tar zx
$ cd pnp4nagios-0.6.16
./configure  \
--prefix=/usr/local/pnp4nagios-0.6.16  \
--with-nagios-user=icinga \
--with-nagios-group=icinga \
--with-rrdtool \
--with-httpd-conf=/usr/local/httpd/conf/extra \
--with-init-dir=/etc/init.d \
--with-perfdata-logfile=/var/log/icinga
$ make all
# make install install-webconf install-config install-init
# ln -s /usr/local/pnp4nagios-0.6.16 /usr/local/pnp4nagios


Before setting up the configuration, I'll explain the art of collecting data of pnp4nagios. Pnp4nagios has 5 kinds of ways to collect data, synchronous-mode, bulk mode, bulk mode with NPCD, bulk mode with npcdmod, and gearman mode. The detail about each way is shown, here. I adopt bulk mode with npcdmod, but I am also showing how to setup bulk mode with NPCD.

setup bulk mode with NPCD

  • setup configuration files
# cd /usr/local/pnp4nagios/etc/
# mv npcd.cfg-sample npcd.cfg
# mv process_perfdata.cfg-sample process_perfdata.cfg
# mv rra.cfg-sample rra.cfg
  • setup icinga.cfg
# cat >> /usr/local/icinga/etc/icinga.cfg << EOF
## Bulk / NPCD mode
process_performance_data=1
# service performance data
service_perfdata_file=/usr/local/pnp4nagios/var/service-perfdata
service_perfdata_file_template=DATATYPE::SERVICEPERFDATA\tTIMET::\$TIMET\$\tHOSTNAME::\$HOSTNAME\$\tSERVICEDESC::\$SERVICEDESC\$\tSERVICEPERFDATA::\$SERVICEPERFDATA
\$\tSERVICECHECKCOMMAND::\$SERVICECHECKCOMMAND\$\tHOSTSTATE::\$HOSTSTATE\$\tHOSTSTATETYPE::\$HOSTSTATETYPE\$\tSERVICESTATE::\$SERVICESTATE\$\tSERVICESTATETYPE::\$SERVI
CESTATETYPE\$
service_perfdata_file_mode=a
service_perfdata_file_processing_interval=15
service_perfdata_file_processing_command=process-service-perfdata-file

# host performance data starting with Nagios 3.0
host_perfdata_file=/usr/local/pnp4nagios/var/host-perfdata
host_perfdata_file_template=DATATYPE::HOSTPERFDATA\tTIMET::\$TIMET\$\tHOSTNAME::\$HOSTNAME\$\tHOSTPERFDATA::\$HOSTPERFDATA\$\tHOSTCHECKCOMMAND::\$HOSTCHECKCOMMAND\$\
tHOSTSTATE::\$HOSTSTATE\$\tHOSTSTATETYPE::\$HOSTSTATETYPE\$
host_perfdata_file_mode=a
host_perfdata_file_processing_interval=15
host_perfdata_file_processing_command=process-host-perfdata-file
EOF
  • setup commands.cfg
# cat >> /usr/local/icinga/etc/objects/commands.cfg << EOF
## Bulk with NPCD mode
define command{
     command_name    process-service-perfdata-file
     command_line    /bin/mv /usr/local/pnp4nagios/var/service-perfdata /usr/local/pnp4nagios/var/spool/service-perfdata.\$TIMET\$
}

define command{
     command_name    process-host-perfdata-file
     command_line    /bin/mv /usr/local/pnp4nagios/var/host-perfdata /usr/local/pnp4nagios/var/spool/host-perfdata.\$TIMET\$
}
EOF
  • start apache, npcd, and icinga daemon
# /etc/init.d/httpd start
# /etc/init.d/npcd start
# /etc/init.d/icinga restart
  • check the configuration settings and performance data
    It passes without critical error.
# wget http://verify.pnp4nagios.org/verify_pnp_config
# perl verify_pnp_config -m bulk+npcd -c /usr/local/icinga/etc/icinga.cfg -p /usr/local/pnp4nagios/etc/
[INFO]  ========== Starting Environment Checks ============
[INFO]  My version is: verify_pnp_config-0.6.17-R.33
[INFO]  Reading /usr/local/icinga/etc/icinga.cfg
[OK  ]  Running product is 'icinga'
[OK  ]  object_cache_file is defined
[OK  ]  object_cache_file=/usr/local/icinga/var/objects.cache
[INFO]  Reading /usr/local/icinga/var/objects.cache
[OK  ]  resource_file is defined
[OK  ]  resource_file=/usr/local/icinga/etc/resource.cfg
[INFO]  Reading /usr/local/icinga/etc/resource.cfg
[INFO]  Reading /usr/local/pnp4nagios/etc//process_perfdata.cfg
[OK  ]  No pnp4nagios_release file found. This might be an older version of PNP4Nagios
[OK  ]  Effective User is 'icinga'
[OK  ]  User icinga exists with ID '1002'
[OK  ]  Effective group is 'icinga'
[OK  ]  Group icinga exists with ID '1002'
[INFO]  ========== Checking Bulk Mode + NPCD Config  ============
[OK  ]  process_performance_data is 1 compared with '/1/'
[OK  ]  service_perfdata_file is defined
[OK  ]  service_perfdata_file=/usr/local/pnp4nagios/var/service-perfdata
[OK  ]  service_perfdata_file_template is defined
[OK  ]  service_perfdata_file_template=DATATYPE::SERVICEPERFDATA\tTIMET::$TIMET$\tHOSTNAME::$HOSTNAME$\tSERVICEDESC::$SERVICEDESC$\tSERVICEPERFDATA::$SERVICEPERFDATA$\tSERVICECHECKCOMMAND::$SERVICECHECKCOMMAND$\tHOSTSTATE::$HOSTSTATE$\tHOSTSTATETYPE::$HOSTSTATETYPE$\tSERVICESTATE::$SERVICESTATE$\tSERVICESTATETYPE::$SERVICESTATETYPE$
[OK  ]  PERFDATA template looks good
[OK  ]  service_perfdata_file_mode is defined
[OK  ]  service_perfdata_file_mode=a
[OK  ]  service_perfdata_file_processing_interval is defined
[OK  ]  service_perfdata_file_processing_interval=15
[OK  ]  service_perfdata_file_processing_command is defined
[OK  ]  service_perfdata_file_processing_command=process-service-perfdata-file
[OK  ]  host_perfdata_file is defined
[OK  ]  host_perfdata_file=/usr/local/pnp4nagios/var/host-perfdata
[OK  ]  host_perfdata_file_template is defined
[OK  ]  host_perfdata_file_template=DATATYPE::HOSTPERFDATA\tTIMET::$TIMET$\tHOSTNAME::$HOSTNAME$\tHOSTPERFDATA::$HOSTPERFDATA$\tHOSTCHECKCOMMAND::$HOSTCHECKCOMMAND$\tHOSTSTATE::$HOSTSTATE$\tHOSTSTATETYPE::$HOSTSTATETYPE$
[OK  ]  PERFDATA template looks good
[OK  ]  host_perfdata_file_mode is defined
[OK  ]  host_perfdata_file_mode=a
[OK  ]  host_perfdata_file_processing_interval is defined
[OK  ]  host_perfdata_file_processing_interval=15
[OK  ]  host_perfdata_file_processing_command is defined
[OK  ]  host_perfdata_file_processing_command=process-host-perfdata-file
[INFO]  Icinga config looks good so far
[INFO]  ========== Checking config values ============
[OK  ]  npcd daemon is running
[OK  ]  /usr/local/pnp4nagios/etc/npcd.cfg is used by npcd and readable
[INFO]  Reading /usr/local/pnp4nagios/etc/npcd.cfg
[OK  ]  perfdata_spool_dir is defined
[OK  ]  perfdata_spool_dir=/usr/local/pnp4nagios/var/spool/
[OK  ]  Command process-service-perfdata-file is defined
[OK  ]  '/bin/mv /usr/local/pnp4nagios/var/service-perfdata /usr/local/pnp4nagios/var/spool/service-perfdata.$TIMET$'
[OK  ]  Command looks good
[OK  ]  Command process-host-perfdata-file is defined
[OK  ]  '/bin/mv /usr/local/pnp4nagios/var/host-perfdata /usr/local/pnp4nagios/var/spool/host-perfdata.$TIMET$'
[OK  ]  Command looks good
[OK  ]  Script /usr/local/pnp4nagios/libexec/process_perfdata.pl is executable
[INFO]  ========== Starting global checks ============
[OK  ]  status_file is defined
[OK  ]  status_file=/usr/local/icinga/var/status.dat
[INFO]  Reading /usr/local/icinga/var/status.dat
[INFO]  ==== Starting rrdtool checks ====
[OK  ]  RRDTOOL is defined
[OK  ]  RRDTOOL=/usr/bin/rrdtool
[OK  ]  /usr/bin/rrdtool is executable
[OK  ]  RRDtool 1.4.7  Copyright 1997-2012 by Tobias Oetiker <tobi@oetiker.ch>
[OK  ]  USE_RRDs is defined
[OK  ]  USE_RRDs=1
[WARN]  Perl RRDs modules are not loadable
[INFO]  ==== Starting directory checks ====
[OK  ]  RRDPATH is defined
[OK  ]  RRDPATH=/usr/local/pnp4nagios/var/perfdata
[OK  ]  Perfdata directory '/usr/local/pnp4nagios/var/perfdata' exists
[WARN]  7 hosts/services are not providing performance data
[WARN]  'process_perf_data 1' is set for 8 hosts/services which are not providing performance data!
[OK  ]  'process_perf_data 1' is set for 34 of your hosts/services
[INFO]  ==== System sizing ====
[OK  ]  33 hosts/service objects defined
[INFO]  ==== Check statistics ====
[WARN]  Warning: 3, Critical: 0
[WARN]  Checks finished...

setup bulk mode with npcdmod

  • setup configuration files
# cd /usr/local/pnp4nagios/etc/
# mv npcd.cfg-sample npcd.cfg
# mv process_perfdata.cfg-sample process_perfdata.cfg
# mv rra.cfg-sample rra.cfg
  • setup icinga.cfg
# cat >> /usr/local/icinga/icinga.cfg << EOF
process_performance_data=1
broker_module=/usr/local/pnp4nagios/lib/npcdmod.o config_file=/usr/local/pnp4nagios/etc/npcd.cfg
EOF
  • start apache, npcd, and icinga
# /etc/init.d/httpd start
# /etc/init.d/npcd start
# /etc/init.d/icinga start
  • icinga.log after enabling the ndomod
# tail -f /var/log/icinga/icinga.log
[1335878074] Caught SIGTERM, shutting down...
[1335878074] Successfully shutdown... (PID=21017)
[1335878074] idomod: Shutdown complete.
[1335878074] Event broker module '/usr/local/icinga/bin/idomod.o' deinitialized successfully.
[1335878074] npcdmod: If you don't like me, I will go out! Bye.
[1335878074] Event broker module '/usr/local/pnp4nagios/lib/npcdmod.o' deinitialized successfully.
[1335878075] Icinga 1.6.1 starting... (PID=21253)
[1335878075] Local time is Tue May 01 22:14:35 JST 2012
[1335878075] LOG VERSION: 2.0
[1335878075] idomod: IDOMOD 1.6.1 (12-02-2011) Copyright(c) 2005-2008 Ethan Galstad, Copyright(c) 2009-2011 Icinga Development Team (https://www.icinga.org)
[1335878075] idomod: Successfully connected to data sink.  0 queued items to flush.
[1335878075] Event broker module '/usr/local/icinga/bin/idomod.o' initialized successfully.
[1335878075] npcdmod: Copyright (c) 2008-2009 Hendrik Baecker (andurin@process-zero.de) - http://www.pnp4nagios.org
[1335878075] npcdmod: /usr/local/pnp4nagios/etc/npcd.cfg initialized
[1335878075] npcdmod: spool_dir = '/usr/local/pnp4nagios/var/spool/'.
[1335878075] npcdmod: perfdata file '/usr/local/pnp4nagios/var/perfdata.dump'.
[1335878075] npcdmod: Ready to run to have some fun!
[1335878075] Event broker module '/usr/local/pnp4nagios/lib/npcdmod.o' initialized successfully.
[1335878075] Finished daemonizing... (New PID=21256)
[1335878076] Event loop started...
  • check the configuration settings and performance data
# wget http://verify.pnp4nagios.org/verify_pnp_config
# perl verify_pnp_config -m npcdmod -c /usr/local/icinga/etc/icinga.cfg -p /usr/local/pnp4nagios/etc/
[INFO]  ========== Starting Environment Checks ============
[INFO]  My version is: verify_pnp_config-0.6.17-R.33
[INFO]  Reading /usr/local/icinga/etc/icinga.cfg
[OK  ]  Running product is 'icinga'
[OK  ]  object_cache_file is defined
[OK  ]  object_cache_file=/usr/local/icinga/var/objects.cache
[INFO]  Reading /usr/local/icinga/var/objects.cache
[OK  ]  resource_file is defined
[OK  ]  resource_file=/usr/local/icinga/etc/resource.cfg
[INFO]  Reading /usr/local/icinga/etc/resource.cfg
[INFO]  Reading /usr/local/pnp4nagios/etc//process_perfdata.cfg
[OK  ]  No pnp4nagios_release file found. This might be an older version of PNP4Nagios
[OK  ]  Effective User is 'icinga'
[OK  ]  User icinga exists with ID '1002'
[OK  ]  Effective group is 'icinga'
[OK  ]  Group icinga exists with ID '1002'
[INFO]  ========== Checking npcdmod Mode Config  ============
[OK  ]  process_performance_data is 1 compared with '/1/'
[OK  ]  event_broker_options is defined
[OK  ]  event_broker_options=-1
[OK  ]  event_broker_option bits 2 and 3 enabled (12)
[OK  ]  broker_module is defined
[OK  ]  broker_module=/usr/local/pnp4nagios/lib/npcdmod.o config_file=/usr/local/pnp4nagios/etc/npcd.cfg
[OK  ]  npcdmod.o config file is /usr/local/pnp4nagios/etc/npcd.cfg
[OK  ]  /usr/local/pnp4nagios/etc/npcd.cfg used by npcdmod.o is readable
[OK  ]  npcd daemon is running
[OK  ]  /usr/local/pnp4nagios/etc/npcd.cfg is used by npcd and readable
[OK  ]  npcd and npcdmod.o are using the same config file (/usr/local/pnp4nagios/etc/npcd.cfg)
[INFO]  Icinga config looks good so far
[INFO]  ========== Checking config values ============
[INFO]  Reading /usr/local/pnp4nagios/etc/npcd.cfg
[OK  ]  Script /usr/local/pnp4nagios/libexec/process_perfdata.pl is executable
[INFO]  ========== Starting global checks ============
[OK  ]  status_file is defined
[OK  ]  status_file=/usr/local/icinga/var/status.dat
[INFO]  Reading /usr/local/icinga/var/status.dat
[INFO]  ==== Starting rrdtool checks ====
[OK  ]  RRDTOOL is defined
[OK  ]  RRDTOOL=/usr/bin/rrdtool
[OK  ]  /usr/bin/rrdtool is executable
[OK  ]  RRDtool 1.4.7  Copyright 1997-2012 by Tobias Oetiker <tobi@oetiker.ch>
[OK  ]  USE_RRDs is defined
[OK  ]  USE_RRDs=1
[WARN]  Perl RRDs modules are not loadable
[INFO]  ==== Starting directory checks ====
[OK  ]  RRDPATH is defined
[OK  ]  RRDPATH=/usr/local/pnp4nagios/var/perfdata
[OK  ]  Perfdata directory '/usr/local/pnp4nagios/var/perfdata' exists
[WARN]  7 hosts/services are not providing performance data
[WARN]  'process_perf_data 1' is set for 8 hosts/services which are not providing performance data!
[OK  ]  'process_perf_data 1' is set for 34 of your hosts/services
[INFO]  ==== System sizing ====
[OK  ]  33 hosts/service objects defined
[INFO]  ==== Check statistics ====
[WARN]  Warning: 3, Critical: 0
[WARN]  Checks finished...

Integrate pnp4nagios into icinga-web

  • integrate XML extension
# cp /usr/local/src/icinga-web-1.6.2/contrib/PNP_Integration/templateExtensions/* \
/usr/local/icinga-web/app/modules/Cronks/data/xml/extensions/
  • clear cache
# /usr/local/icinga-web/bin/clearcache.sh
Basedir: /usr/local/icinga-web-1.6.2 Cachedir: /usr/local/icinga-web-1.6.2/app/cache
Deleting cache from config (70 files) ... ok
Deleting cache from Squished (4 files) ... ok
  • restart icinga
# /etc/init.d/icinga restart

Verify pnp4nagios and icinga-web with pnp4nagios

_images/pnp4nagios_env.png


  • remove install.php if test passes
# rm -f /usr/local/pnp4nagios-0.6.16/share/install.php
_images/pnp4nagios_overview.png
  • icinga-web with pnp4nagios(pop-up performance graph)
_images/icinga-web_pnp4nagios_01.png
  • performance graph in detail
_images/icinga-web_pnp4nagios_02.png


I'm going to introduce about configurations, especially init scripts.

iJAWS@Doorkeeper